Tutorial#
Phillosophy of the framework#
Titania was built by drawing from the experience of working with the monitoring app for previous generation of the Velo detector at LHCb. Any monitoring tas can be split into three independent parts: Data, Exploration, Plotting.
The Data, means all of the means and ways of getting the desired data. It can mean connection to a database, reading a binary file, or calling external REST API.
Exploration is the way of browsing this data, selecting different time periods, or switching the source of the data.
Plotting is well.. plotting. To be honest, since this is python, it mostly means matplotlib package, but any other plotting package like seaborn will do.
All of those in Titania come together under Views. Views are the way of connecting those parts to create a coherent information and monitoring layout.
This design allows for separation of functions. You are allowed to use this framework in any way that suits you, but the most important thing is to remember to split the funcionalities of your work. Keep you data, separate from your plots. Write your code, in such way that it can be reused, because, this is exactly why this framework exists. In turn, you should be able to import the data from the other views, connect them with different plots, and maybe create custom exploration style.
Data#
Okay, let’s make some code. I’m assuming here that you have set up a project using the start page.
First lets get some data. We will do this by requesting a temperature data using HTTP request.
import urllib.request
import json
import datetime

response = urllib.request.urlopen("https://www.7timer.info/bin/astro.php?lon=6.097&lat=46.241&ac=0&unit=metric&output=json&tzshift=0").read()
data = json.loads(response)
temp = [v['temp2m'] for v in data['dataseries']]
timepoints = [v['timepoint'] for v in data['dataseries']]
initial_date = datetime.datetime.strptime(data['init'], "%Y%m%d%H")

print(temp)
print(timepoints)
print(initial_date)
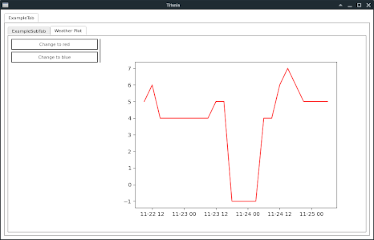
This piece of code will get the temperature forecast data, the timepoints of the forecast (expressed in hours), and initial date of the forecast:
[5, 6, 4, 4, 4, 4, 4, 4, 4, 5, 5, -1, -1, -1, -1, 4, 4, 6, 7, 6, 5, 5, 5, 5]
[3, 6, 9, 12, 15, 18, 21, 24, 27, 30, 33, 36, 39, 42, 45, 48, 51, 54, 57, 60, 63, 66, 69, 72]
2021-11-22 06:00:00
The next step is to put this into more pythonic format of date using datetime
exact_timepoints = [initial_date+datetime.timedelta(hours=h) for h in timepoints]
Now let’s put that into titania framework, in weather_data.py inside data/ folder:
import urllib.request
import json
import datetime
from titania.data.data_core import TitaniaDataInterface

class WeatherData(TitaniaDataInterface):
    def __init__(self):
        self.request_string = "https://www.7timer.info/bin/astro.php?lon=6.097&lat=46.241&ac=0&unit=metric&output=json&tzshift=0"

    def fetch(self):
        response = urllib.request.urlopen(self.request_string).read()
        data = json.loads(response)
        temp = [v['temp2m'] for v in data['dataseries']]
        timepoints = [v['timepoint'] for v in data['dataseries']]
        initial_date = datetime.datetime.strptime(data['init'], "%Y%m%d%H")
        exact_timepoints = [initial_date+datetime.timedelta(hours=h) for h in timepoints]
        return temp, exact_timepoints
As you can see we just defined titania data class! The requirements are as follows:
implement function fetch() method (
titania.data.data_core.TitaniaDataInterface.fetch())
And that’s it!
Plots#
Next, let’s create some plotting action:
from titania.plots.base_plot import MplPlot

class WeatherPlot(MplPlot):
    def __init__(self, parent=None, view=None, *args, **kwargs):
        MplPlot.__init__(self, parent=parent, view=view)
        self.color = 'blue'

    def draw_plot(self, data=None) -> None:
        self.figure.clear()
        ax = self.figure.add_subplot(self.plot_number)
        temp, timepoints = self.view.data.fetch()
        ax.plot(timepoints, temp, color=self.color)
        self.draw()
This is a simple class that just draw’s a plot.
It inherits from titania.plots.base_plot.MplPlot class.
It implements draw_plot method for drawing. If you are familiar with matplotlib, then this should be self-explanatory, if not well, you should learn about matplotlib :)
Exploration#
You can see that the panels/control_panel.py already exists.
At first glance it contains a lot of code. But in reality this is just an filler code.
We will simplify all of this with a new panel in panels/weather_panel.py
from titania.panels import ControlPanelInterface
from PyQt5.QtWidgets import QVBoxLayout, QPushButton

class WeatherControlPanel(ControlPanelInterface):
    def __init__(self, data=None, widget=None):
        self.widget = widget

        self.control_panel = QVBoxLayout()

        self.red = QPushButton("Change to red")
        self.blue = QPushButton("Change to blue")

        self.control_panel.addWidget(self.red)
        self.control_panel.addWidget(self.blue)
        self.red.clicked.connect(self.change_color_to_red)
        self.blue.clicked.connect(self.change_color_to_blue)

    def change_color_to_red(self):
        self.widget.plot.color = 'red'
        self.widget.plot.draw_plot()

    def change_color_to_blue(self):
        self.widget.plot.color = 'blue'
        self.widget.plot.draw_plot()

    def get_control_panel(self):
        return self.control_panel
Now, this code contains elemtns of the Qt library. In short what’s happening here is that we are inheriting from titania.panels.main_control_panel.ControlPanelInterface. We are implementing its get_control_panel method.
Also, we are creating two buttons, on the panel. “Change to red” and “change to blue”. Using Qt, we connect the action of clicking those buttons to changin the property of the plot object named color, to either red or blue.
View#
The last thing that we need to implement is the view class, in views/weather_gui.py
from panels.weather_panel import WeatherControlPanel
from data.weather_data import WeatherData
from plots.weather_plot import WeatherPlot
from titania.QtGUI.base_tab import QtBaseLayoutTab


class WeatherGUI(QtBaseLayoutTab):
    def __init__(self, parent=None):
        super().__init__(data=WeatherData(), parent=parent)

    def make_plot(self):
        return WeatherPlot(parent=self.parent, view=self)

    def get_title(self):
        return "Weather Plot"

    def create_control_panel(self):
        return WeatherControlPanel(widget=self)
This class inherits from titania.QtGUI.base_tab.QtBaseLayoutTab, and as you can see it utilises all 3 previous classes.
Config#
The last things is to add our newly written view to the config:
from views.thresholds_gui import ThresholdsTab
from views.weather_gui import WeatherGUI
config = {
    "ExampleTab": [ThresholdsTab, WeatherGUI],
}
Run your project#
And that’s it, you can run the project using python main.py.
If you would like to learn more about writing monitoring with Titania, you should check out the implementation folder and check out other examples.
Additionally there is also an option of making web interface with titania, which also is shown in the implementations folder.
Optimising and building on top#
You might have noticed that changing the colours in this example takes some to be executed.
This is because each time the colour is changed, the WeatherData.fetch() method is executed, and it makes an HTTP request which can take some time.
We can optimise this using existing code like this:
class WeatherDataCached(WeatherData):
    def __init__(self):
        WeatherData.__init__(self)
        self.last_check = None
        self.data = None

    def fetch(self):
        now = datetime.datetime.now()
        if self.last_check is None:
            self.last_check = datetime.datetime.now()
        else:
            dif = now-self.last_check
            if  dif.seconds//(5*60) >= 1:
                self.data=None
                self.last_check = now
        if self.data is None:
            self.data = WeatherData.fetch(self)
        return self.data
Additionally you need to change the class used in views/weather_gui.py to WeatherDataCached to make this work.
Now each time the method fetch() is called, it checks how old is the data, and if it is older than 5 minutes, gets the data from the API.